Dive into your creative stream
Statistics - Blog Posts
Results for my poll on Tumblr browsing preferences!
Here's a refresher of the poll. I asked everyone how they prefer to use Tumblr. Many thanks to the 95 awesome people who participated!

(Puts on technical writer's cap) I used glittering.world's Tumblr poll result grabber to get the exact numbers for each option. Since no one selected the last option, I excluded it from my analysis. I popped the results into Excel and made this pretty table and pie chart.
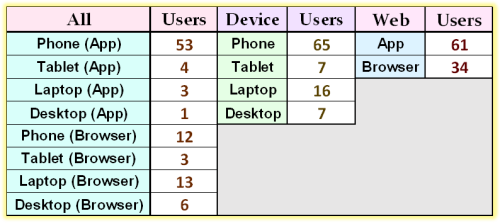

It's not too surprising to see that over half of the participants use the Tumblr app on their phones. Laptop users and phone users who browse Tumblr on their device browser have the second and third biggest numbers.
Here are two more breakdowns of the data! The next pie chart shows the number and percentage of people who use each device listed in the poll.

In case they're difficult to read, the numbers in the pie chart are listed as "Number, Percentage". As we've seen before, phones are very popular!
The last pie chart shows the number/percentage of Tumblr users who use the app (the most popular preference!) vs. a browser.

On an unrelated note, this poll was a great excuse to go aggressively girly with the color and styling of these charts! It was something I had always wanted to do for my college lab reports but ended up toning down to not shock anyone.😅
That's all I've got. Hope you enjoyed this micro stats report. El Droide out!
There are 17 days left until my Statistics exam👀