Dive into your creative stream
Typhoon - Blog Posts


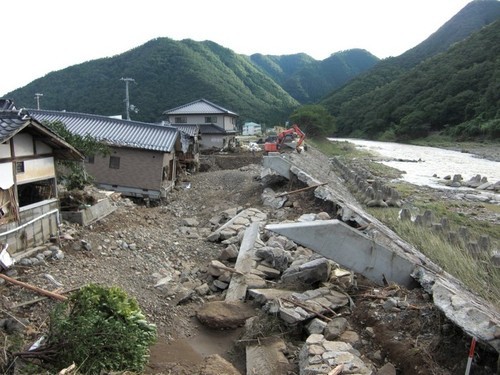
Sean bienvenidos, japonistasarqueológicos a una nueva entrega, en esta ocasión hablaré sobre actualidad nipona, una vez dicho esto pónganse cómodos que empezamos. — El domingo 16 de julio, azotaron fuertes lluvias al archipiélago nipón y hace no mucho el tifón Lan paralizó el tráfico aéreo de Japón y dejó miles de evacuados al oeste, además sin electricidad. Pero en este caso se han anegado muchas zonas del norte, causando efectos geográficos catastróficos y causando evacuaciones, etc. Por ejemplo: La ciudad de Akita registró precipitaciones, fue un récord, más de 250 milímetros durante un período de 48 horas, todo un hito histórico. — Espero que os guste y nos vemos en próximas publicaciones, que pasen una buena semana. - Welcome, Japanese archaeologists, to a new installment, this time I will be talking about Japanese current affairs, and once that is said, make yourselves comfortable and let's get started. - On Sunday 16th July, heavy rains hit the Japanese archipelago and not long ago Typhoon Lan paralysed Japan's air traffic and left thousands of evacuees in the west without electricity. But in this case many areas in the north have been flooded, causing catastrophic geographical effects and causing evacuations, etc. For example: The city of Akita recorded record rainfall of more than 250 millimetres over a 48-hour period, a historic milestone. - I hope you like it and see you in future posts, have a good week. - 日本の考古学者たちよ、新しい回へようこそ。今回は日本の時事問題についてお話しします。そう言ったら、くつろいで、始めましょう。 - 7月16日の日曜日、日本列島は大雨に見舞われ、少し前には台風12号が日本の空の便を麻痺させ、西日本では何千人もの避難者が停電に見舞われた。しかし今回は、北部の多くの地域が浸水し、地理的に壊滅的な影響を引き起こし、避難などを余儀なくされている。例えば:秋田市では、48時間に250ミリ以上の記録的な雨量を記録し、歴史的な出来事となった。 - お気に召していただけたなら幸いである.
Weathering the Storm with our Global Precipitation Measurement Mission
How much rain falls in a hurricane? How much snow falls in a nor’easter? What even is a nor’easter? These are the sorts of questions answered by our Global Precipitation Measurement Mission, or GPM.
GPM measures precipitation: Rain, snow, sleet, freezing rain, hail, ice pellets. It tells meteorologists the volume, intensity and location of the precipitation that falls in weather systems, helping them improve their forecasting, gather information about extreme weather and better understand Earth’s energy and water cycles.
And putting all that together, one of GPM’s specialties is measuring storms.
GPM is marking its fifth birthday this year, and to celebrate, we’re looking back on some severe storms that the mission measured in its first five years.
1. The Nor’easter of 2018

A nor’easter is a swirling storm with strong northeasterly winds and often lots of snow. In January 2018, the mission’s main satellite, the Core Observatory, flew over the East Coast in time to capture the development of a nor’easter. The storm dumped 18 inches of snow in parts of New England and unleashed winds up to 80 miles per hour!
2. Hurricane Harvey

Hurricane Harvey came to a virtual halt over eastern Texas in August 2017, producing the largest rain event in U.S. history. Harvey dropped up to 5 feet of rain, causing $125 billion in damage. The Core Observatory passed over the storm several times, using its radar and microwave instruments to capture the devastating deluge.
3. Typhoon Vongfong
In October 2014, GPM flew over one of its very first Category 5 typhoons – tropical storms with wind speeds faster than 157 miles per hour. The storm was Typhoon Vongfong, which caused $48 million in damage in Japan, the Philippines and Taiwan. We were able to see both the pattern and the intensity of Vongfong’s rain, which let meteorologists know the storm’s structure and how it might behave.
4. Near Real-Time Global Precipitation Calculations
The Core Observatory isn’t GPM’s only satellite! A dozen other satellites from different countries and government agencies come together to share their microwave measurements with the Core Observatory. Together, they are called the GPM Constellation, and they create one of its most impressive products, IMERG.
IMERG stands for “Integrated Multi-satellitE Retrievals for GPM,” and it uses the info from all the satellites in the Constellation to calculate global precipitation in near real time. In other words, we can see where it’s raining anywhere in the world, practically live.
5. Hurricane Ophelia
Hurricane Ophelia hit Ireland and the United Kingdom in October 2017, pounding them with winds up to 115 miles per hour, reddening the skies with dust from the Sahara Desert and causing more than $79 million in damages. Several satellites from the Constellation passed over Ophelia, watching this mid-latitude weather system develop into a Category 3 hurricane – the easternmost Category 3 storm in the satellite era (since 1970).
From the softest snow to the fiercest hurricanes, GPM is keeping a weather eye open for precipitation around the world. And we’re on cloud nine about that.
Make sure to follow us on Tumblr for your regular dose of space: http://nasa.tumblr.com
Solar System: Things to Know This Week

It’s the time of year for summer break, swimming, and oh, yes storms. June 1 marks the beginning of hurricane season on the Atlantic coast, but we’re not alone. Our neighboring planets have seen their fair share of volatile weather, too (like the Cassini spacecraft’s view of the unique six-sided jet stream at Saturn’s north pole known as “the hexagon”).
This week, we present 10 of the solar system’s greatest storms.

1. Jupiter’s Great Red Spot
With tumultuous winds peaking at 400 mph, the Great Red Spot has been swirling wildly over Jupiter’s skies for at least 150 years and possibly much longer. People saw a big spot on Jupiter as early as the 1600s when they started stargazing through telescopes, though it’s unclear whether they were looking at a different storm. Today, scientists know the Great Red Spot has been there for a while, but what causes its swirl of reddish hues remains to be discovered. More >

2. Jupiter’s Little Red Spot
Despite its unofficial name, the Little Red Spot is about as wide as Earth. The storm reached its current size when three smaller spots collided and merged in the year 2000. More >

3. Saturn’s Hexagon
The planet’s rings might get most of the glory, but another shape’s been competing for attention: the hexagon. This jet stream is home to a massive hurricane tightly centered on the north pole, with an eye about 50 times larger than the average hurricane eye on Earth. Numerous small vortices spin clockwise while the hexagon and hurricane spin counterclockwise. The biggest of these vortices, seen near the lower right corner of the hexagon and appearing whitish, spans about 2,200 miles, approximately twice the size of the largest hurricane on Earth. More>
4. Monster Storm on Saturn
A tempest erupted in 2010, extending approximately 9,000 miles north-south large enough to eventually eat its own tail before petering out. The storm raged for 200 days, making it the longest-lasting, planet-encircling storm ever seen on Saturn. More >

5. Mars’ Dust Storm
Better cover your eyes. Dust storms are a frequent guest on the Red Planet, but one dust storm in 2001 larger by far than any seen on Earth raised a cloud of dust that engulfed the entire planet for three months. As the Sun warmed the airborne dust, the upper atmospheric temperature rose by about 80 degrees Fahrenheit. More >

6. Neptune’s Great Dark Spot
Several large, dark spots on Neptune are similar to Jupiter’s hurricane-like storms. The largest spot, named the “Great Dark Spot” by its discoverers, contains a storm big enough for Earth to fit neatly inside. And, it looks to be an anticyclone similar to Jupiter’s Great Red Spot. More >

7. Sun Twister
Not to be confused with Earth’s tornadoes, a stalk-like prominence rose up above the Sun, then split into about four strands that twisted themselves into a knot and dispersed over a two-hour period. This close-up shows the effect is one of airy gracefulness. More >

8. Titan’s Arrow-shaped Storm
The storm blew across the equatorial region of Titan, creating large effects in the form of dark and likely “wet” from liquid hydrocarbons areas on the surface of the moon. The part of the storm visible here measures 750 miles in length east-to-west. The wings of the storm that trail off to the northwest and southwest from the easternmost point of the storm are each 930 miles long. More >

9. Geomagnetic Storms
On March 9, 1989, a huge cloud of solar material exploded from the sun, twisting toward Earth. When this cloud of magnetized solar material called a coronal mass ejection reached our planet, it set off a chain of events in near-Earth space that ultimately knocked out an entire power grid area to the Canadian province Quebec for nine hours. More >
10. Super Typhoon Tip
Back on Earth, Typhoon Tip of 1979 remains the biggest storm to ever hit our planet, making landfall in Japan. The tropical cyclone saw sustained winds peak at 190 mph and the diameter of circulation spanned approximately 1,380 miles. Fortunately, we now have plans to better predict future storms on Earth. NASA recently launched a new fleet of hurricane-tracking satellites, known as the Cyclone Global Navigation Satellite System (CYGNSS), which will use the same GPS technology you and I use in our cars to measure wind speed and ultimately improve how to track and forecast hurricanes. More >
Discover more lists of 10 things to know about our solar system HERE.
Make sure to follow us on Tumblr for your regular dose of space: http://nasa.tumblr.com
