Dive into your creative stream
Storms - Blog Posts
STORMS IN WITCHCRAFT
RAIN STORM: GROWTH AND REBIRTH. SHEDDING OLD SKIN
LIGHTENING STORM: POTENT MAGICAL POWER HEXES AND CURSES
SNOW STORM: PURITY, ENDINGS, CHANGE, HOME AND HEARTH WORK
TORNADO: ERRATIC BUT POWERFUL ENERGY FOR ANY RITUAL, CAN BE UNPREDICTABLE
WIND STORM: POTENT ENERGY FOR A FAST-ACTING SPELL, MENTAL MAGIC
i love the rain. especially listening to it.
im living the lesbian/pansexual dream. sitting under my veranda, in a rocking chair, listening to the rain on the roof.
pitter patter, pitter patter.
If Monsoon and Autumn had children, one of them would be me.
The definition of happiness.


monsoon moodboard for the rainy days
"and the earth itself.... its loveliest fragrance is known only when it receives a shower of rain. and the scent of wet earth rises as though it were giving something beautiful back to the clouds." // ruskin bond, rain in the mountains
drxgonfly: Lightnings over Brooklyn (by Marcin Skromak) drxgonfly: Lightnings over Brooklyn (by Marcin Skromak)


Lightnings over Brooklyn (by Marcin Skromak)
Can we get a Lore Dump about Weather?
Lore Dump about Weather
Weather is a founding Keeper, but is nicknamed the minor of the founding Keepers. They kinda didn’t have anything to do for a while and just messed with Space by blowing winds through their nebulas and using hydrogen from stars to make some makeshift storms that would blow through the universe
Weather is typically rather calm and collected, occasionally loosing their cool and going off on the other keepers. They’ve learned to not make Weather angry, since their revenge works slowly over time. There are rumors that Weather broke the sacred timeline in spite of how often Time “pushed them around“ as they say.
Weather’s personal realm is a small forested area that typically is being rained on. Weather has a small cabin they stay in.
Weather isn’t the most hated Keeper, per se, but they’re definitely on the list of “These Keepers suck to deal with”. Space is a pushover however, and Weather often messes with their work.
In a Warming World, NASA’s Eyes Offer Crucial Views of Hurricanes
June 1 marks the start of hurricane season in the Atlantic Ocean. Last year’s hurricane season saw a record-setting 30 named storms. Twelve made landfall in the United States, also a record. From space, NASA has unique views of hurricanes and works with other government agencies -- like the National Oceanographic and Atmospheric Administration (NOAA) -- to better understand individual storms and entire hurricane seasons.

Here, five ways NASA is changing hurricane science:
1. We can see storms from space
From space, we can see so much more than what’s visible to the naked eye. Among our missions, NASA and NOAA have joint satellite missions monitoring storms in natural color -- basically, what our eyes see -- as well as in other wavelengths of light, which can help identify features our eyes can’t on their own. For instance, images taken in infrared can show the temperatures of clouds, as well as allow us to track the movement of storms at night.

2. We can see inside hurricanes in 3D
If you’ve ever had a CT scan or X-ray done, you know how important 3D imagery can be to understanding what’s happening on the inside. The same concept applies to hurricanes. Our Global Precipitation Measurement mission’s radar and microwave instruments can see through storm clouds to see the precipitation structure of the storm and measure how much total rain is falling as a result of the storm. This information helps scientists understand how the storm may change over time and understand the risk of severe flooding.
We can even virtually fly through hurricanes!

3. We’re looking at how climate change affects hurricane behavior
Climate change is likely causing storms to behave differently. One change is in how storms intensify: More storms are increasing in strength quickly, a process called rapid intensification, where hurricane wind speeds increase by 35 mph (or more) in just 24 hours.
In 2020, a record-tying nine storms rapidly intensified. These quick changes in storm strength can leave communities in their path without time to properly prepare.
Researchers developed a machine learning model that could more accurately detect rapidly intensifying storms.

It’s not just about how quickly hurricanes gain strength. We’re also looking at how climate change may be causing storms to move more slowly, which makes them more destructive. These “stalled” storms can slow to just a few miles an hour, dumping rain and damaging winds on one location at a time. Hurricane Dorian, for example, stalled over Grand Bahama and left catastrophic damage in its wake. Hurricanes Harvey and Florence experienced stalling as well, both causing major flooding.

4. We can monitor damage done by hurricanes
Hurricane Maria reshaped Puerto Rico’s forests. The storm destroyed so many large trees that the overall height of the island’s forests was shortened by one-third. Measurements from the ground, the air, and space gave researchers insights into which trees were more susceptible to wind damage.

Months after Hurricane Maria, parts of Puerto Rico still didn’t have power. Using satellite data, researchers mapped which neighborhoods were still dark and analyzed demographics and physical attributes of the areas with the longest wait for power.

5. We help communities prepare for storms and respond to their aftermath
The data we collect is available for free to the public. We also partner with other federal agencies, like the Federal Emergency Management Agency (FEMA), and regional and local governments to help prepare for and understand the impacts of disasters like hurricanes.
In 2020, our Disasters Program provided data to groups in Alabama, Louisiana, and Central America to identify regions significantly affected by hurricanes. This helps identify vulnerable communities and make informed decisions about where to send resources.

The 2021 Atlantic hurricane season starts today, June 1. Our colleagues at NOAA are predicting another active season, with an above average number of named storms. At NASA, we’re developing new technology to study how storms form and behave, including ways to understand Earth as a system. Working together with our partners at NOAA, FEMA and elsewhere, we’re ready to help communities weather another year of storms.
Bonus: We see storms on other planets, too!
Earth isn’t the only planet with storms. From dust storms on Mars to rains made of glass, we study storms and severe weather on planets in our solar system and beyond. Even the Sun has storms. Jupiter’s Great Red Spot, for instance, is a hurricane-like storm larger than the entire Earth.

Make sure to follow us on Tumblr for your regular dose of space: http://nasa.tumblr.com.

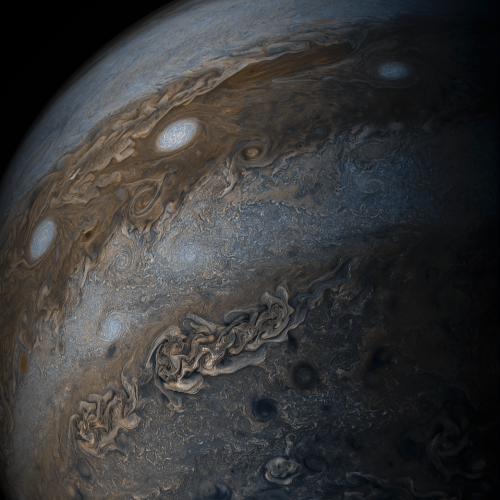
It was a dark and stormy flyby...
Our @NASAJuno spacecraft's JunoCam captured images of the chaotic, stormy northern hemisphere of Jupiter during its 24th close pass of the giant planet on Dec. 26, 2019. Using data from the flyby, citizen scientist Kevin M. Gill created this color-enhanced image. At the time, the spacecraft was about 14,600 miles (23,500 kilometers) from the tops of Jupiter’s clouds, at a latitude of about 69 degrees north.
Image Credit: Image data: NASA/JPL-Caltech/SwRI/MSSS
Image processing by Kevin M. Gill, © CC BY
Make sure to follow us on Tumblr for your regular dose of space: http://nasa.tumblr.com
It’s a Bird! It’s a Plane! It’s NASA’s Five Newest Airborne Campaigns!
We’re not just doing research in space! From the land, the sea and the sky, we study our planet up close. Right now, we’re gearing up for our newest round of Earth Expeditions, using planes, boats and instruments on the ground to study Earth and how it’s changing.

The newest round of campaigns takes place all across the United States – from Virginia to Louisiana to Kansas to California.

The five newest missions will combine measurements from the ground, the sea, air and space to investigate storms, sea level rise and processes in the atmosphere and ocean.
Let’s meet the newest Earth science missions:
1. IMPACTS
The Investigation of Microphysics and Precipitation for Atlantic Coast-Threatening Snowstorms will start from Wallops Flight Facility in Virginia to understand how bands of snow form during winter storms in the East Coast. This research will help us better forecast intense snowfall during extreme winter weather.

2. ACTIVATE
Flying out of Langley Research Center, the Aerosol Cloud Meteorology Interactions over the Western Atlantic Experiment is studying how specific types of clouds over oceans affect Earth’s energy balance and water cycle. The energy balance is the exchange of heat and light from the Sun entering Earth’s atmosphere vs. what escapes back into space.

3. Delta-X
Farther south, Delta-X is flying three planes around the Mississippi River Delta to study how land is deposited and maintained by natural processes. Studying these processes can help us understand what will happen as sea levels continue to rise.

4. DCOTSS
Heading out to the Midwest this summer, the Dynamics and Chemistry of the Summer Stratosphere mission will study how thunderstorms can carry pollutants from high in the atmosphere deep into the lower stratosphere, where they can affect ozone levels.

5. S-MODE
About 200 miles off the coast of San Francisco, the Sub-Mesoscale Ocean Dynamics Experiment is using ships, planes and gliders to study the impact that ocean eddies have on how heat moves between the ocean and the atmosphere.

These missions are kicking off in January, so stay tuned for our updates from the field! You can follow along with NASA Expeditions on Twitter and Facebook.

Make sure to follow us on Tumblr for your regular dose of space: http://nasa.tumblr.com.
Hurricanes Have No Place to Hide, Thanks to Better Satellite Forecasts

If you’ve ever looked at a hurricane forecast, you’re probably familiar with “cones of uncertainty,” the funnel-shaped maps showing a hurricane’s predicted path. Thirty years ago, a hurricane forecast five days before it made landfall might have a cone of uncertainty covering most of the East Coast. The result? A great deal of uncertainty about who should evacuate, where it was safe to go, and where to station emergency responders and their equipment.

Over the years, hurricane forecasters have succeeded in shrinking the cone of uncertainty for hurricane tracks, with the help of data from satellites. Polar-orbiting satellites, which fly nearly directly above the North and South Poles, are especially important in helping cut down on forecast error.

The orbiting electronic eyeballs key to these improvements: the Joint Polar Satellite System (JPSS) fleet. A collaborative effort between NOAA and NASA, the satellites circle Earth, taking crucial measurements that inform the global, regional and specialized forecast models that have been so critical to hurricane track forecasts.

The forecast successes keep rolling in. From Hurricanes Harvey, Irma and Maria in 2017 through Hurricanes Florence and Michael in 2018, improved forecasts helped manage coastlines, which translated into countless lives and property saved. In September 2018, with the help of this data, forecasters knew a week ahead of time where and when Hurricane Florence would hit. Early warnings were precise enough that emergency planners could order evacuations in time — with minimal road clogging. The evacuations that did not have to take place, where residents remained safe from the hurricane’s fury, were equally valuable.

The satellite benefits come even after the storms make landfall. Using satellite data, scientists and forecasters monitor flooding and even power outages. Satellite imagery helped track power outages in Puerto Rico after Hurricane Maria and in the Key West area after Hurricane Irma, which gave relief workers information about where the power grid was restored – and which regions still lacked electricity.

Flood maps showed the huge extent of flooding from Hurricane Harvey and were used for weeks after the storm to monitor changes and speed up recovery decisions and the deployment of aid and relief teams.

As the 2019 Atlantic hurricane season kicks off, the JPSS satellites, NOAA-20 and Suomi-NPP, are ready to track hurricanes and tropical cyclones as they form, intensify and travel across the ocean – our eyes in the sky for severe storms.
For more about JPSS, follow @JPSSProgram on Twitter and facebook.com/JPSS.Program, or @NOAASatellites on Twitter and facebook.com/NOAASatellites.
Make sure to follow us on Tumblr for your regular dose of space: http://nasa.tumblr.com.
A Tour of Storms Across the Solar System

Earth is a dynamic and stormy planet with everything from brief, rumbling thunderstorms to enormous, raging hurricanes, which are some of the most powerful and destructive storms on our world. But other planets also have storm clouds, lightning — even rain, of sorts. Let’s take a tour of some of the unusual storms in our solar system and beyond.
Tune in May 22 at 3 p.m. for more solar system forecasting with NASA Chief Scientist Jim Green during the latest installment of NASA Science Live: https://www.nasa.gov/nasasciencelive.

1. At Mercury: A Chance of Morning Micrometeoroid Showers and Magnetic ‘Tornadoes’
Mercury, the planet nearest the Sun, is scorching hot, with daytime temperatures of more than 800 degrees Fahrenheit (about 450 degrees Celsius). It also has weak gravity — only about 38% of Earth's — making it hard for Mercury to hold on to an atmosphere.
Its barely there atmosphere means Mercury doesn’t have dramatic storms, but it does have a strange "weather" pattern of sorts: it’s blasted with micrometeoroids, or tiny dust particles, usually in the morning. It also has magnetic “tornadoes” — twisted bundles of magnetic fields that connect the planet’s magnetic field to space.

2. At Venus: Earth’s ‘Almost’ Twin is a Hot Mess
Venus is often called Earth's twin because the two planets are similar in size and structure. But Venus is the hottest planet in our solar system, roasting at more than 800 degrees Fahrenheit (430 degrees Celsius) under a suffocating blanket of sulfuric acid clouds and a crushing atmosphere. Add to that the fact that Venus has lightning, maybe even more than Earth.
In visible light, Venus appears bright yellowish-white because of its clouds. Earlier this year, Japanese researchers found a giant streak-like structure in the clouds based on observations by the Akatsuki spacecraft orbiting Venus.

3. At Earth: Multiple Storm Hazards Likely
Earth has lots of storms, including thunderstorms, blizzards and tornadoes. Tornadoes can pack winds over 300 miles per hour (480 kilometers per hour) and can cause intense localized damage.
But no storms match hurricanes in size and scale of devastation. Hurricanes, also called typhoons or cyclones, can last for days and have strong winds extending outward for 675 miles (1,100 kilometers). They can annihilate coastal areas and cause damage far inland.

4. At Mars: Hazy with a Chance of Dust Storms
Mars is infamous for intense dust storms, including some that grow to encircle the planet. In 2018, a global dust storm blanketed NASA's record-setting Opportunity rover, ending the mission after 15 years on the surface.
Mars has a thin atmosphere of mostly carbon dioxide. To the human eye, the sky would appear hazy and reddish or butterscotch colored because of all the dust suspended in the air.

5. At Jupiter: A Shrinking Icon
It’s one of the best-known storms in the solar system: Jupiter’s Great Red Spot. It’s raged for at least 300 years and was once big enough to swallow Earth with room to spare. But it’s been shrinking for a century and a half. Nobody knows for sure, but it's possible the Great Red Spot could eventually disappear.

6. At Saturn: A Storm Chasers Paradise
Saturn has one of the most extraordinary atmospheric features in the solar system: a hexagon-shaped cloud pattern at its north pole. The hexagon is a six-sided jet stream with 200-mile-per-hour winds (about 322 kilometers per hour). Each side is a bit wider than Earth and multiple Earths could fit inside. In the middle of the hexagon is what looks like a cosmic belly button, but it’s actually a huge vortex that looks like a hurricane.
Storm chasers would have a field day on Saturn. Part of the southern hemisphere was dubbed "Storm Alley" by scientists on NASA's Cassini mission because of the frequent storm activity the spacecraft observed there.

7. At Titan: Methane Rain and Dust Storms
Earth isn’t the only world in our solar system with bodies of liquid on its surface. Saturn’s moon Titan has rivers, lakes and large seas. It’s the only other world with a cycle of liquids like Earth’s water cycle, with rain falling from clouds, flowing across the surface, filling lakes and seas and evaporating back into the sky. But on Titan, the rain, rivers and seas are made of methane instead of water.
Data from the Cassini spacecraft also revealed what appear to be giant dust storms in Titan’s equatorial regions, making Titan the third solar system body, in addition to Earth and Mars, where dust storms have been observed.

8. At Uranus: A Polar Storm
Scientists were trying to solve a puzzle about clouds on the ice giant planet: What were they made of? When Voyager 2 flew by in 1986, it spotted few clouds. (This was due in part to the thick haze that envelops the planet, as well as Voyager's cameras not being designed to peer through the haze in infrared light.) But in 2018, NASA’s Hubble Space Telescope snapped an image showing a vast, bright, stormy cloud cap across the north pole of Uranus.

9. At Neptune: Methane Clouds
Neptune is our solar system's windiest world. Winds whip clouds of frozen methane across the ice giant planet at speeds of more than 1,200 miles per hour (2,000 kilometers per hour) — about nine times faster than winds on Earth.
Neptune also has huge storm systems. In 1989, NASA’s Voyager 2 spotted two giant storms on Neptune as the spacecraft zipped by the planet. Scientists named the storms “The Great Dark Spot” and “Dark Spot 2.”

10. It’s Not Just Us: Extreme Weather in Another Solar System
Scientists using NASA’s Hubble Space Telescope made a global map of the glow from a turbulent planet outside our solar system. The observations show the exoplanet, called WASP-43b, is a world of extremes. It has winds that howl at the speed of sound, from a 3,000-degree-Fahrenheit (1,600-degree-Celsius) day side, to a pitch-black night side where temperatures plunge below 1,000 degrees Fahrenheit (500 degrees Celsius).
Discovered in 2011, WASP-43b is located 260 light-years away. The planet is too distant to be photographed, but astronomers detected it by observing dips in the light of its parent star as the planet passes in front of it.
Make sure to follow us on Tumblr for your regular dose of space: http://nasa.tumblr.com.

Jupiter’s vibrant bands of light belts and dark regions appear primed for their close-up during our Juno spacecraft’s 10th flyby on Feb. 7. This flyby was a gravity science positioned pass. During orbits that highlight gravity experiments, Juno is positioned toward Earth in a way that allows both transmitters to downlink data in real-time to one of the antennas of our Deep Space Network. All of Juno’s science instruments and the spacecraft’s JunoCam were in operation during the flyby, collecting data that is now being returned to Earth. The science behind this beautifully choreographed image will help us understand the origin and structure of the planet beneath those lush, swirling clouds.
Make sure to follow us on Tumblr for your regular dose of space: http://nasa.tumblr.com
The 2017 Atlantic Hurricane Season: What We Learned

The 2017 Atlantic hurricane season was among the top ten most active seasons in recorded history. Our experts are exploring what made this year particularly active and the science behind some of the biggest storms to date.

After a period of 12 years without a Category 3 or higher hurricane making landfall in the U.S., Hurricane Harvey made landfall over Texas as a Category 4 hurricane this August.
Harvey was also the biggest rainfall event ever to hit the continental U.S. with estimates more than 49 inches of rain.

Data like this from our Global Precipitation Measurement Mission, which shows the amount of rainfall from the storm and temperatures within the story, are helping scientists better understand how storms develop.

The unique vantage point of satellites can also help first responders, and this year satellite data helped organizations map out response strategies during hurricanes Harvey, Irma and Maria.

In addition to satellites, we use ground stations and aircraft to track hurricanes.

We also use the capabilities of satellites like Suomi NPP and others that are able to take nighttime views. In this instance, we were able to view the power outages in Puerto Rico. This allowed first responders to see where the location of impacted urban areas.

The combined effort between us, NOAA, FEMA and other federal agencies helps us understand more about how major storms develop, how they gain strength and how they affect us.

To learn more about how we study storms, go to www.nasa.gov/Hurricanes.
Make sure to follow us on Tumblr for your regular dose of space: http://nasa.tumblr.com.
How Do Hurricanes Form?
Hurricanes are the most violent storms on Earth. People call these storms by other names, such as typhoons or cyclones, depending on where they occur.

The scientific term for ALL of these storms is tropical cyclone. Only tropical cyclones that form over the Atlantic Ocean or eastern and central Pacific Ocean are called “hurricanes.”

Whatever they are called, tropical cyclones all form the same way.
Tropical cyclones are like giant engines that use warm, moist air as fuel. That is why they form only over warm ocean waters near the equator. This warm, moist air rises and condenses to form clouds and storms.

As this warmer, moister air rises, there's less air left near the Earth's surface. Essentially, as this warm air rises, this causes an area of lower air pressure below.

This starts the 'engine' of the storm. To fill in the low pressure area, air from surrounding areas with higher air pressure pushes in. That “new” air near the Earth's surface also gets heated by the warm ocean water so it also gets warmer and moister and then it rises.

As the warm air continues to rise, the surrounding air swirls in to take its place. The whole system of clouds and wind spins and grows, fed by the ocean’s heat and water evaporating from the surface.
As the storm system rotates faster and faster, an eye forms in the center. It is vey calm and clear in the eye, with very low air pressure.

Tropical cyclones usually weaken when they hit land, because they are no longer being “fed” by the energy from the warm ocean waters. However, when they move inland, they can drop many inches of rain causing flooding as well as wind damage before they die out completely.
There are five types, or categories, of hurricanes. The scale of categories is called the Saffir-Simpson Hurricane Scale and they are based on wind speed.

How Does NASA Study Hurricanes?
Our satellites gather information from space that are made into pictures. Some satellite instruments measure cloud and ocean temperatures. Others measure the height of clouds and how fast rain is falling. Still others measure the speed and direction of winds.

We also fly airplanes into and above hurricanes. The instruments aboard planes gather details about the storm. Some parts are too dangerous for people to fly into. To study these parts, we use airplanes that operate without people.
Learn more about this and other questions by exploring NASA Space Place and the NASA/NOAA SciJinks that offer explanations of science topics for school kids.
Make sure to follow us on Tumblr for your regular dose of space: http://nasa.tumblr.com.
Credits: NASA Space Place & NASA/NOAA SciJinks
Studying Storms from Air and Space
Technology we’ve developed is helping study the movement of storms.
From satellites that can slice through a hurricane with 3-D vision to computer models of gale force winds, scientists now have unprecedented ways of viewing extreme weather.
This August, we’re sending an unmanned aircraft called a Global Hawk to study hurricanes. This mission is called the “East Pacific Origins and Characteristics of Hurricanes,” or EPOCH. It will fly over developing tropical storms to investigate how they progress and intensify.

The three instruments aboard this Global Hawk aircraft will map out 3-D patterns of temperature, pressure, humidity, precipitation and wind speed as well as the role of the East Pacific Ocean in global cyclone formation. These measurements will help scientists better understand the processes that control storm intensity and the role of the East Pacific Ocean in global cyclone formation.

To better understand hurricane formation and intensity, scientists also utilize models and other observations.

Satellites such as our Global Precipitation Measurement Mission, or GPM, and computer models can analyze key stages of storm intensification.

In September 2016, GPM captured Hurricane Matthew’s development from a Category 1 to Category 5 hurricane in less than 24 hours.

Extreme rainfall was seen in several stages of the storm, causing significant flooding and landslides when it passed by Cuba, Haiti and the Dominican Republic.

By combining model and observed data, scientists can analyze storms like never before. They can also better understand how hurricanes and other powerful storms can potentially impact society.
Make sure to follow us on Tumblr for your regular dose of space: http://nasa.tumblr.com
Swirling bands of light and dark clouds on Jupiter are seen in this image made by citizen scientists using data from our Juno spacecraft. Each of the alternating light and dark atmospheric bands in this image is wider than Earth, and each rages around Jupiter at hundreds of miles (km) per hour. The lighter areas are regions where gas is rising, and the darker bands are regions where gas is sinking. This image was acquired on May 19, 2017 from about 20,800 miles (33,400km) above Jupiter's cloud tops. Learn more
Credits: NASA/JPL-Caltech/SwRI/MSSS/Gerald Eichstädt /Seán Doran
Make sure to follow us on Tumblr for your regular dose of space: http://nasa.tumblr.com
Solar System: Things to Know This Week

It’s the time of year for summer break, swimming, and oh, yes storms. June 1 marks the beginning of hurricane season on the Atlantic coast, but we’re not alone. Our neighboring planets have seen their fair share of volatile weather, too (like the Cassini spacecraft’s view of the unique six-sided jet stream at Saturn’s north pole known as “the hexagon”).
This week, we present 10 of the solar system’s greatest storms.

1. Jupiter’s Great Red Spot
With tumultuous winds peaking at 400 mph, the Great Red Spot has been swirling wildly over Jupiter’s skies for at least 150 years and possibly much longer. People saw a big spot on Jupiter as early as the 1600s when they started stargazing through telescopes, though it’s unclear whether they were looking at a different storm. Today, scientists know the Great Red Spot has been there for a while, but what causes its swirl of reddish hues remains to be discovered. More >

2. Jupiter’s Little Red Spot
Despite its unofficial name, the Little Red Spot is about as wide as Earth. The storm reached its current size when three smaller spots collided and merged in the year 2000. More >

3. Saturn’s Hexagon
The planet’s rings might get most of the glory, but another shape’s been competing for attention: the hexagon. This jet stream is home to a massive hurricane tightly centered on the north pole, with an eye about 50 times larger than the average hurricane eye on Earth. Numerous small vortices spin clockwise while the hexagon and hurricane spin counterclockwise. The biggest of these vortices, seen near the lower right corner of the hexagon and appearing whitish, spans about 2,200 miles, approximately twice the size of the largest hurricane on Earth. More>
4. Monster Storm on Saturn
A tempest erupted in 2010, extending approximately 9,000 miles north-south large enough to eventually eat its own tail before petering out. The storm raged for 200 days, making it the longest-lasting, planet-encircling storm ever seen on Saturn. More >

5. Mars’ Dust Storm
Better cover your eyes. Dust storms are a frequent guest on the Red Planet, but one dust storm in 2001 larger by far than any seen on Earth raised a cloud of dust that engulfed the entire planet for three months. As the Sun warmed the airborne dust, the upper atmospheric temperature rose by about 80 degrees Fahrenheit. More >

6. Neptune’s Great Dark Spot
Several large, dark spots on Neptune are similar to Jupiter’s hurricane-like storms. The largest spot, named the “Great Dark Spot” by its discoverers, contains a storm big enough for Earth to fit neatly inside. And, it looks to be an anticyclone similar to Jupiter’s Great Red Spot. More >

7. Sun Twister
Not to be confused with Earth’s tornadoes, a stalk-like prominence rose up above the Sun, then split into about four strands that twisted themselves into a knot and dispersed over a two-hour period. This close-up shows the effect is one of airy gracefulness. More >

8. Titan’s Arrow-shaped Storm
The storm blew across the equatorial region of Titan, creating large effects in the form of dark and likely “wet” from liquid hydrocarbons areas on the surface of the moon. The part of the storm visible here measures 750 miles in length east-to-west. The wings of the storm that trail off to the northwest and southwest from the easternmost point of the storm are each 930 miles long. More >

9. Geomagnetic Storms
On March 9, 1989, a huge cloud of solar material exploded from the sun, twisting toward Earth. When this cloud of magnetized solar material called a coronal mass ejection reached our planet, it set off a chain of events in near-Earth space that ultimately knocked out an entire power grid area to the Canadian province Quebec for nine hours. More >
10. Super Typhoon Tip
Back on Earth, Typhoon Tip of 1979 remains the biggest storm to ever hit our planet, making landfall in Japan. The tropical cyclone saw sustained winds peak at 190 mph and the diameter of circulation spanned approximately 1,380 miles. Fortunately, we now have plans to better predict future storms on Earth. NASA recently launched a new fleet of hurricane-tracking satellites, known as the Cyclone Global Navigation Satellite System (CYGNSS), which will use the same GPS technology you and I use in our cars to measure wind speed and ultimately improve how to track and forecast hurricanes. More >
Discover more lists of 10 things to know about our solar system HERE.
Make sure to follow us on Tumblr for your regular dose of space: http://nasa.tumblr.com
GOES-R: The Future of Forecasting

What is GOES-R?
The Geostationary Operational Environmental Satellite-R Series (GOES-R) is the nation’s next generation of geostationary weather satellites. It is the first of four satellites to be launched for the National Oceanic and Atmospheric Administration (NOAA).
The GOES-R satellite will provide advanced imaging with increased spatial resolution and faster coverage for more accurate forecasts, real-time mapping of lightning activity and improved monitoring of solar activity. For the first time, GOES-R will be able to monitor the Earth in near real-time.

Once in geostationary orbit (the orbit around the Earth’s equator), it will provide images of weather patterns and severe storms across the continental U.S. as regularly as every five minutes. Images of smaller, more detailed areas, where storm activity is present, will be taken as frequently as every 30 seconds.
These images can be used to aid in formulating regular forecasts, term forecasting, such as seasonal predictions and drought outlooks.

In addition, the satellite will constantly monitor space weather conditions, such as solar flares, to provide advance notice of potential communication and navigation disruptions.

The satellite will also assist researchers in understanding the interactions between land, oceans, the atmosphere and climate.
What will GOES-R Do?
Improve hurricane tracking and intensity forecasts
Increase thunderstorm and tornado warning lead time
Give earlier warning of ground lightning strike hazards
Improve detection of heavy rainfall and flash flooding risks
Improve air quality warnings and alerts
Give better fire detection and intensity estimation
Improve solar flare warnings for communications and navigation disruptions
Give more accurate monitoring of energetic particles responsible for radiation hazards to humans and spacecraft
Improve monitoring of space weather to get better geomagnetic storm forecasting.
The better we can predict what’s coming, the better we can prepare.
Launch Activities!
The GOES-R satellite is targeted for a launch on Saturday, Nov. 19, aboard a United Launch Alliance Atlas V rocket.

The one-hour launch window opens at 5:42 p.m. EST. Liftoff will occur from our Kennedy Space Center in Florida.
Join us leading up to launch by tuning in during the following times:
Thursday, Nov. 17 Prelaunch News Conference - 1 p.m. EST Watch HERE
GOES-R Mission Briefing - 2 p.m. EST Watch HERE
Friday, Nov. 18 GOES-R Social Presentations – 1:30 p.m. EST Watch HERE
Saturday, Nov. 19 NASA Edge Prelaunch Program – 3:45 p.m. EST Watch HERE
Launch Coverage & Commentary – 4:45 p.m. EST Watch HERE
Make sure to follow us on Tumblr for your regular dose of space: http://nasa.tumblr.com